After crypto’s worst Q1 since 2018, ETF inflows have turned positive, and $268 billion in stablecoins sits on the sidelines waiting for a catalyst.
Crypto markets enter the second quarter battered but structurally sounder than price charts alone suggest, according to Nexo’s latest market dispatch.
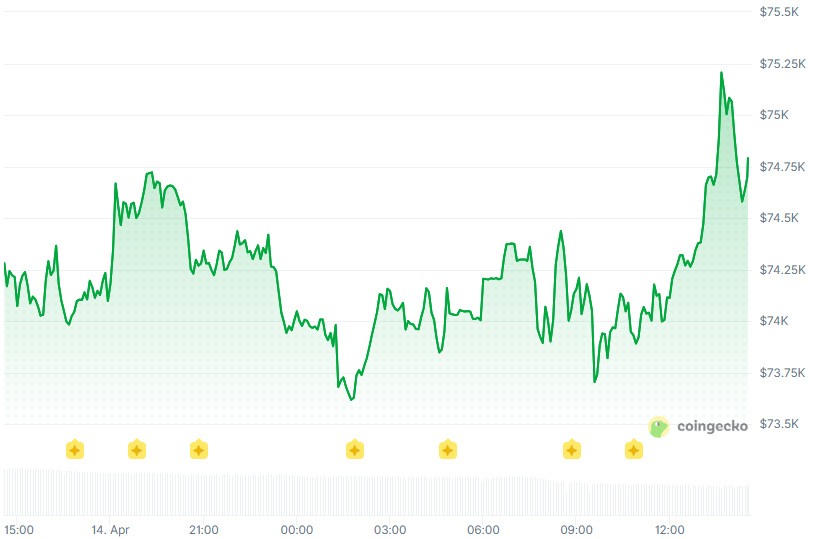
Bitcoin posted its worst Q1 decline since 2018, dragged down by a conflict that disrupted the Strait of Hormuz, renewed tariff escalation, and the collapse of expectations for Federal Reserve rate cuts. Yet the selloff is absorbing faster than in past cycles. On the weekly chart, a double-bottom formation has emerged; on the daily, price is testing the upper Bollinger Band with an RSI approaching overbought and no signs of exhaustion.
What matters most for momentum, though, is flows. Bitcoin and Ethereum ETFs reversed a sustained multi-week net outflow streak in early March, and the trend has held: April’s trailing seven-day inflow is running above $500 million. Notably, while gold ETFs bled nearly $11 billion in outflows following the outbreak of the Iran war, Bitcoin ETFs continued to attract capital.
The institutional bid is deepening on multiple fronts. Morgan Stanley last week became the first Wall Street bank to launch its own Bitcoin ETF while also filing for Ethereum and Solana trusts. The move matters given the bank’s roughly $7 trillion wealth management platform. But the market is two-sided: retail is fading, with CryptoQuant data showing small-account inflows on Binance at a nine-year low.
Leverage Flushed
The derivatives landscape reinforces the constructive picture. Open interest in BTC perpetual futures has recovered 31% from its March low to $33.2 billion, but the quality of the recovery matters more than the size. The 3-month rolling basis has compressed from nearly 5% in January to 1.6% today. At 5%, the market was stuffed with carry traders shorting futures against spot; when that premium collapsed, they exited mechanically, amplifying the selloff. At 1.6%, that trade is gone, leaving directional positioning without a leverage overlay, the cleanest derivatives structure since before the October peak.
Ethereum and DeFi
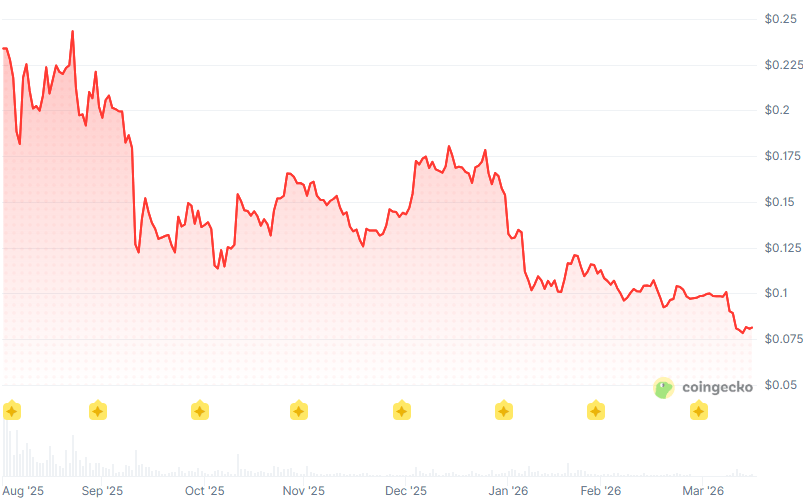
On Ethereum, the gap between fundamentals and price has rarely been wider. ETH is down 55% from its August 2025 peak, yet stablecoin supply on the network hit $180 billion in Q1, and JPMorgan, BlackRock, and Amundi have all launched tokenized funds on the network.
A joint report from Keyrock and Securitize found that tokenized T-bills outperformed DeFi’s benchmark stablecoin lending rate on 98% of days in Q1 2026, underscoring the yield advantage of drawing traditional capital on-chain. ETFs now hold around 10% of total ETH supply, while public companies own more than 6.1 million ETH, or roughly 5% of circulating supply.
Regulatory catalysts loom large. Last week, the FDIC proposed a framework for stablecoin issuers supervised under the GENIUS Act, with all regulators facing a July 18 deadline to issue final rules. The CLARITY Act, which stalled in Q1 over a stablecoin yield dispute, is back in negotiation with a Senate Banking Committee markup targeted for late April, potentially making May the pivotal month for legislative progress.
Meanwhile, capital remains parked. The top-five stablecoin supply sits near all-time highs at $267.9 billion. Tokenized real-world assets on-chain reached $29 billion as of April 12, an all-time high, up 1,576% since January 2024. The dry powder sitting in stablecoins, tokenized Treasuries, and vaults is waiting on three catalysts to unlock the next leg: geopolitical de-escalation, a Fed pivot signal, and CLARITY Act progress.
This article was written with the assistance of AI workflows. All our stories are curated, edited and fact-checked by a human.