: Sensex drops 583 points, Nifty slips below 24,000; check top gainers and losers list?")


Bitcoin is on the defensive as April draws to a close, though seasonal trends suggest any pullbacks may prove short-lived, potentially paving the way for a renewed move higher in the weeks ahead.
Data going back to 2013 shows that May tends to be a bullish month for the largest cryptocurrency, with gains in seven of the past 13 years. While the average return of around 8% is less impressive than stronger months like October and November, it still points to a positive bias.
Coming on the heels of April’s roughly 10% gain, the seasonal pattern suggests the broader uptrend could remain intact. The outlook is supported by similar bullish seasonality in the S&P 500, which is already hovering near record highs.
Back-to-back net monthly inflows into the U.S.-listed spot exchange-traded funds (ETFs) indicate strong institutional demand and support the bullish case. These ETFs have pulled in over $1.8 billion this month following March’s $1.32 billion.
This is an excerpt from CoinDesk newsletter ‘Daybook.’ Sign up here, if you haven’t already.
Still, traders need to keep an eye on bond markets, where rising yields are posing a headwind to risk assets.
“Bitcoin’s failure to sustain above $78K and the subsequent drift back toward $75K suggests the market is digesting the “higher-for-longer” signal,” Jake Kennis, a research analyst at Nansen, said in an email. “Absent a liquidity catalyst, it appears range-bound rather than setting up for a breakout, with macro headwinds capping near-term upside despite broadly flat performance over 14 days (+0.7%).”
The other risk is a global economic flare-up. Several observers, including energy analyst Anas Alhajji, warned that the negative impact of the Iran war and the energy market disruption could tank the global economy in May.
Markus Thielen, the founder of 10X Research, suggested the same in a report to clients on Thursday.
“May is when the lag ends, and the real economy starts paying the bill,” he said. Stay alert!
Read more: For analysis of today’s activity in altcoins and derivatives, see Crypto Markets Today . For a comprehensive list of events this week, see CoinDesk’s “Crypto Week Ahead.”
What’s trending
Today’s signal

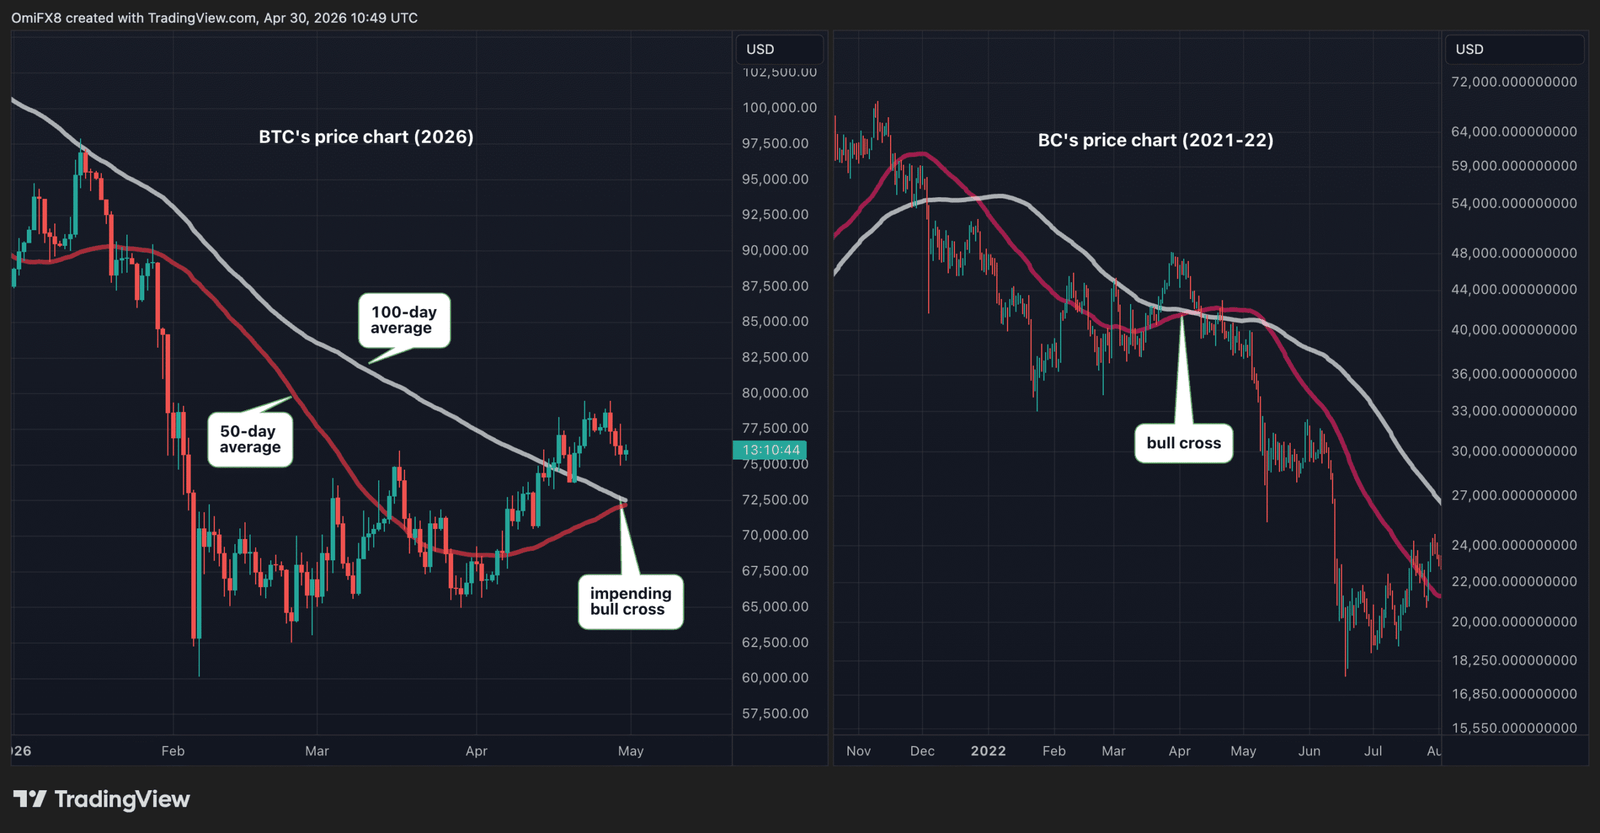
The chart shows bitcoin’s price swings in candlestick format over 2026 and 2021-22. The graphs show two lines: the red one represents the average price over 50 days and the white shows the average over 100 days.
As of today, the 50-day average appears poised to move above the 100-day average. Chart analysts refer to this as a bullish crossover, a signal that short-term momentum is strengthening relative to the medium-term trend and may point to further upside if sustained.
So, the impending crossover suggests more BTC price gains ahead. That said, the indicator has a mixed record, particularly during bear markets. For instance, a similar bull cross occurred in March 2022, as the chart on the right shows. But, it ended up trapping bulls on the wrong side of the market, as prices took a deeper dive in the following weeks.