The creator of the popular technical analysis indicator Bollinger Bands has taken a position in bitcoin, an asset his own indicator is currently flashing bullish on.
John Bollinger, who developed the indicator in the 1980s, said in an X post that one of his investment fund’s proprietary trading models had flipped positive on bitcoin and taken a position accordingly.
Bollinger bands are volatility bands that sit two standard deviations above and below the 20-day moving average of a token’s price. A wider gap between the two bands indicates volatile conditions, while a tighter band indicates calm.
A break above the upper band traditionally signals strong upward momentum, especially after a period of compression.
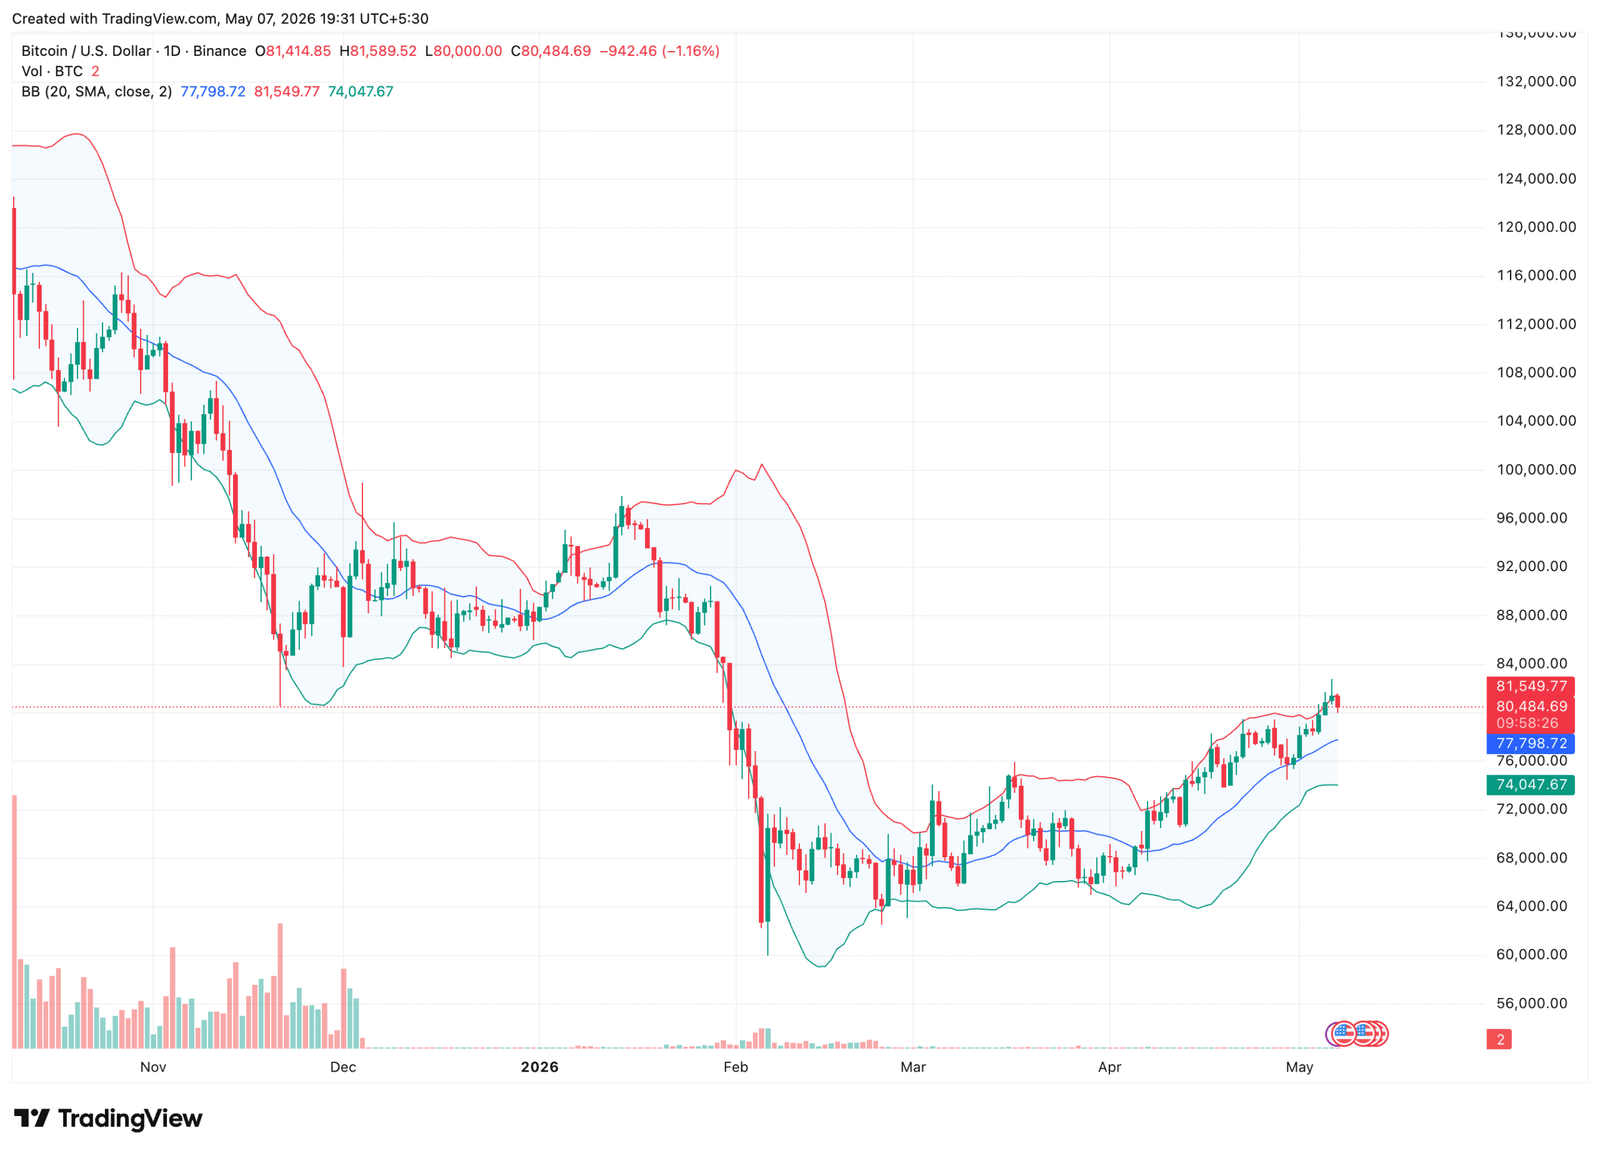
Bitcoin closed above its upper Bollinger Band on the daily chart on Wednesday, the second such close since mid-January, with the price sitting at $80,484 against an upper band reading of $81,549, per TradingView data. The breakout followed the asset’s tightest-ever band reading. These so-called squeezes often set the stage for big moves in either direction.

The chart shows bitcoin’s daily price swings in candlestick format with Bollinger bands.
The setup heading into the weekend is whether bitcoin establishes a foothold above the upper band. That would be a bullish technical signal, while a rejection here puts the price back in the chop zone.
Bitcoin traded above $80,000 at press time. The token is up roughly 9% over the past 30 days but remains 36% below its October 2025 all-time high of $126,000.