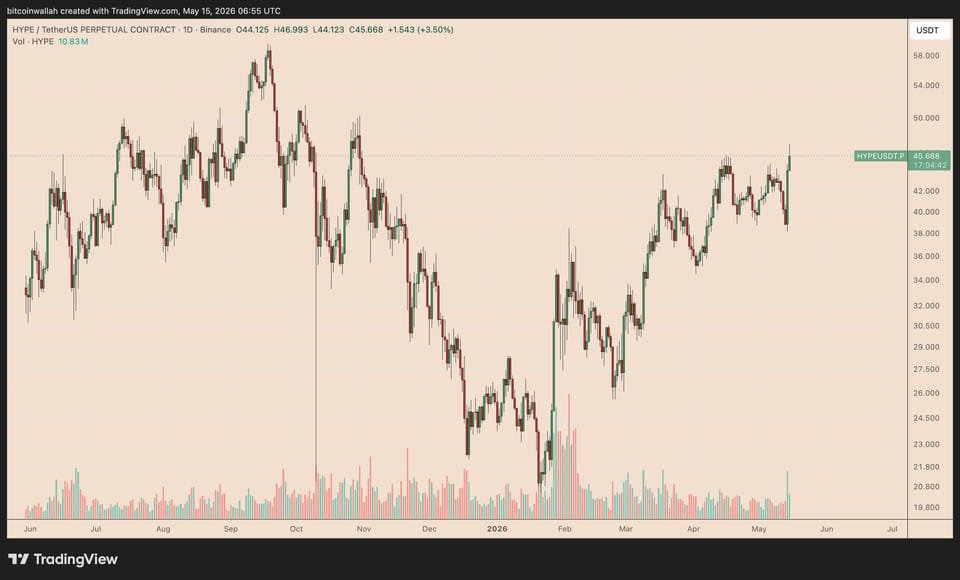
HYPE, the native token of decentralized exchange Hyperliquid, jumped more than 23% in the past 24 hours, climbing toward $47 on Friday to hit its highest level since October 2025.

HYPE/USDT daily chart. Source: TradingView
What is driving the sudden HYPE rally, and does the token have enough momentum to extend its bull run in the coming days?
Key takeaways:
- This week’s multiple US spot HYPE ETF launches have strengthened the token’s institutional-demand narrative.
- Coinbase becoming Hyperliquid’s USDC treasury deployer boosts HYPE prices.
HYPE ETF launches fuel institutional demand hopes
The biggest immediate catalyst behind HYPE’s rally appears to be the arrival of US-listed Hyperliquid exchange-traded products.
On Friday, Bitwise launched its spot Hyperliquid ETF, trading under the ticker BHYP on the NYSE.

HYPE/USDT daily chart. Source: TradingView
The fund gives investors regulated exposure to HYPE and intends to stake a portion of its holdings through Bitwise’s in-house staking division. Its sponsor fee is set at 0.34%, with a full waiver for the first month on the first $500 million in assets.
The launch follows 21Shares’ Hyperliquid ETF, THYP, which debuted on Nasdaq on Tuesday.
A day later, onchain data resource Lookonchain claimed that wallets linked to venture capital firm a16z had purchased nearly $67.5 million worth of HYPE tokens.

Source: X
The purchases reportedly took place in the month leading up to the ETF launches, adding to signs of growing institutional interest in Hyperliquid.
Sustained upside through May will likely depend on whether the HYPE ETFs attract meaningful inflows rather than simply generating launch-week speculation.
As of Friday, they were managing $3.17 million worth of assets, according to SoSoValue data.

US spot HYPE ETFs net flows. Source: SoSoValue
Coinbase, Circle deal adds structural tailwind for HYPE rally
HYPE’s rally also gained momentum after Coinbase announced on Thursday that it had become the official treasury deployer of USDC on Hyperliquid.
The deal strengthens USDC’s role as the main collateral and quote asset across Hyperliquid’s onchain markets.
The stablecoin already accounts for roughly $5 billion in supply on Hyperliquid, making it the dominant stablecoin in the ecosystem, according to DefiLlama.

Stablecoin market cap on Hyperliquid. Source: DefiLlama
Under the upgraded AQAv2 framework, Coinbase is expected to share the vast majority of reserve-yield revenue from USDC deployed on Hyperliquid with the protocol.
Circle will also serve as the technical deployer for USDC on Hyperliquid and has committed to stake 500,000 HYPE tokens.
“It’s an admission that Hyperliquid is too dominant in perps to displace, so better to align and capture distribution,” analyst Aylo said in a Thursday post, adding:
“We should see an increase of ~$140M+ in annualised revenue which will be used to buyback HYPE.”
CLARITY Act progress adds regulatory tailwind
HYPE’s rally also came as US crypto regulation showed signs of progress.
On May 14, the Senate Banking Committee advanced the CLARITY Act in a 15–9 vote, marking a key step for a bill that aims to define when digital assets fall under securities or commodities rules.
The update improved sentiment across crypto markets, sparking intraday rallies in Bitcoin, Ethereum, XRP and other top coins.
Still, the CLARITY Act is not law yet. The bill now heads to the Senate, where it will likely need broader bipartisan support to overcome procedural hurdles.
If it passes the Senate, lawmakers would still need to reconcile it with the House version before sending a final bill to President Donald Trump for approval.
HYPE rising wedge warns of 30% price correction
HYPE’s ongoing upside momentum remains inside what appears to be a rising wedge pattern, confirmed by the price trending inside two converging, upward-sloping trend lines.
In technical analysis, such a wedge typically plays out when the price breaks below its lower trend line and falls to the level at a length equal to the structure’s maximum height.

HYPE/USDT daily chart. Source: TradingView
Applying this rule to the HYPE chart brings its downside target to the $26.5–$31.20 range, depending on the potential breakdown point, as shown above. That means a potential 30%-45% correction by June or July.
Conversely, a decisive breakout above the rising wedge’s upper boundary may invalidate the bearish setup altogether, pushing HYPE’s price toward the $59–$60 range, aligning with the 1.0 Fibonacci retracement level shown below.

HYPE/USDT daily chart. Source: TradingView
HYPE’s daily relative strength index (RSI) also supports the short-term bullish case. The indicator remains below the overbought threshold of 70, suggesting the price still has room to extend its rally.