Bitcoin (BTC) is showing a rare divergence between its falling prices and rising momentum, a setup that last appeared around the FTX-era market bottom.
Key takeaways:
- Bitcoin’s second weekly bullish divergence on record is hinting at a rally toward $90,000.
- The cryptocurrency is also holding near its 200-week SMA, a level that has historically acted as a bottom zone during the 2015, 2018 and 2020 bear markets.
Bitcoin’s last bullish divergence preceded a 755% rally
As of Monday, BTC’s weekly relative strength index (RSI) was over 34, almost two weeks after slipping under the oversold threshold of 30. In the same period, the price dropped to around $63,000 from $75,770.
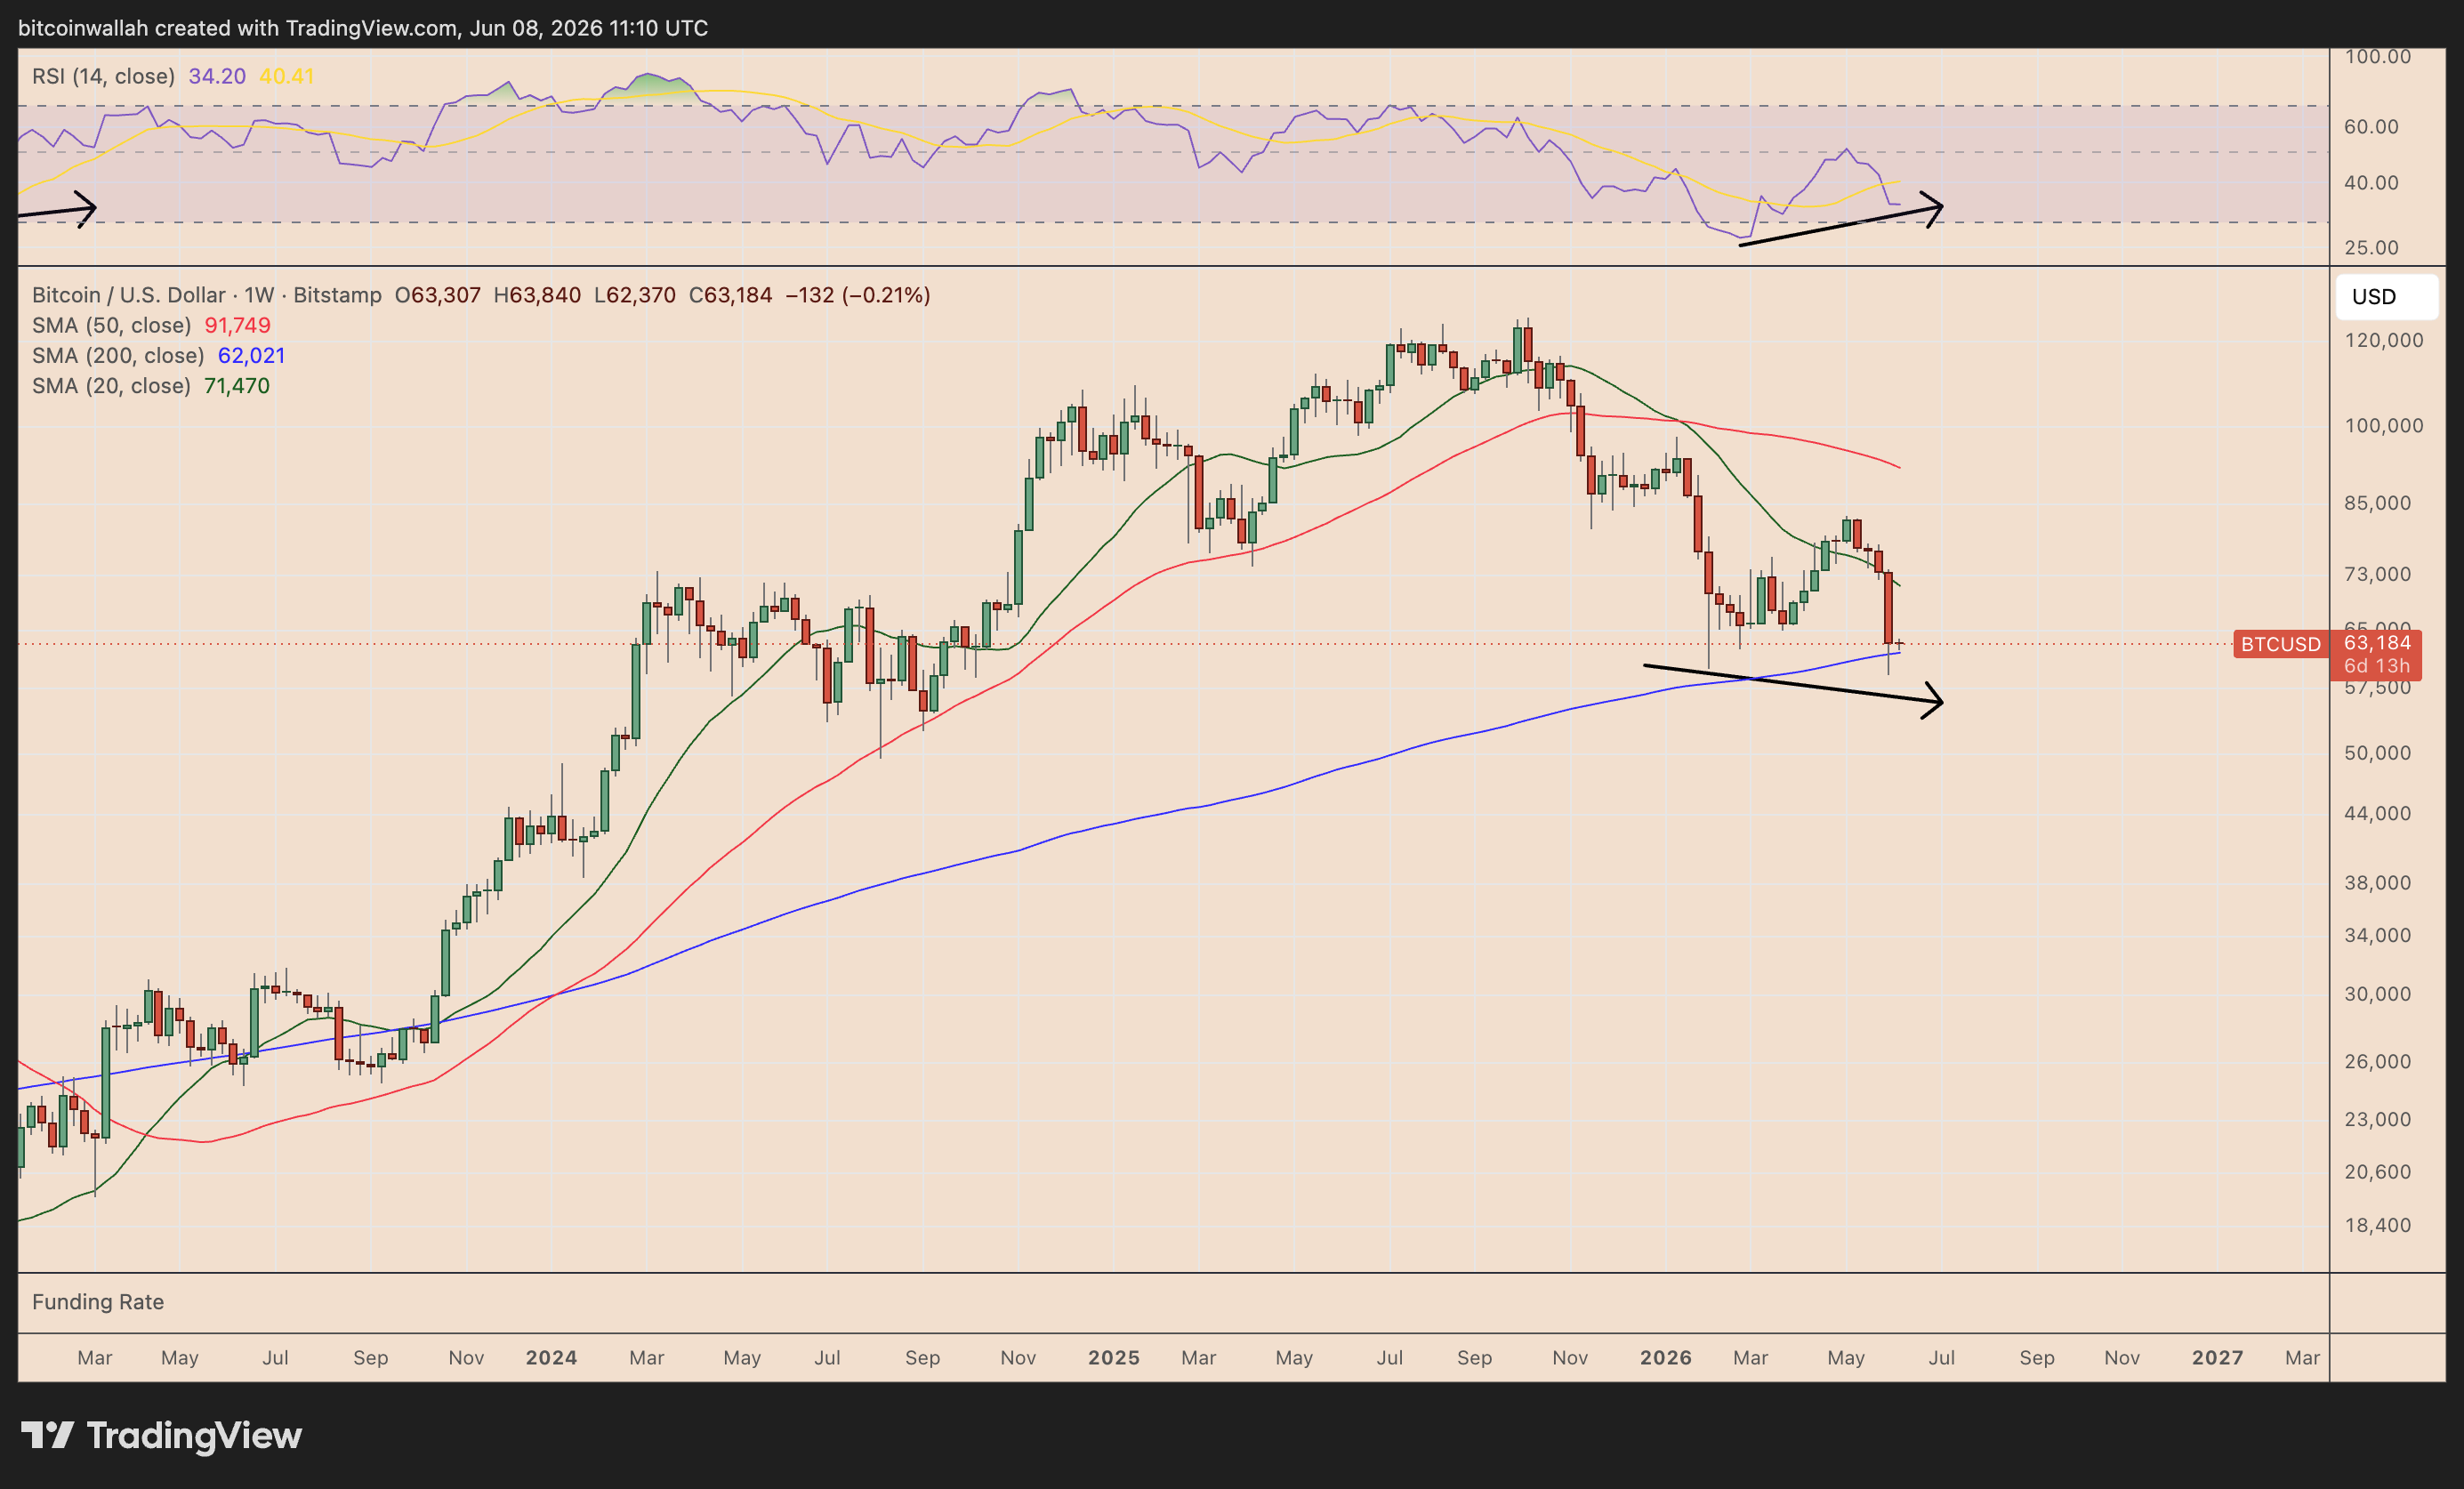
BTC/USD weekly chart. Source: TradingView
Bitcoin is still falling to lower price levels, confirming that sellers remain active. However, its RSI is no longer dropping alongside price. Instead, the momentum indicator has rebounded from oversold territory and is now forming a higher low.
In technical analysis, this is known as a bullish divergence. It occurs when the price continues to weaken, but the underlying momentum starts improving. The setup often suggests that selling pressure is losing strength before price confirms a rebound.
A confirmed divergence this week would mark only the second such signal on Bitcoin’s weekly chart. The first followed the FTX crash in November 2022, preceding a 715% rally from around $15,500 to a record high near $126,200.
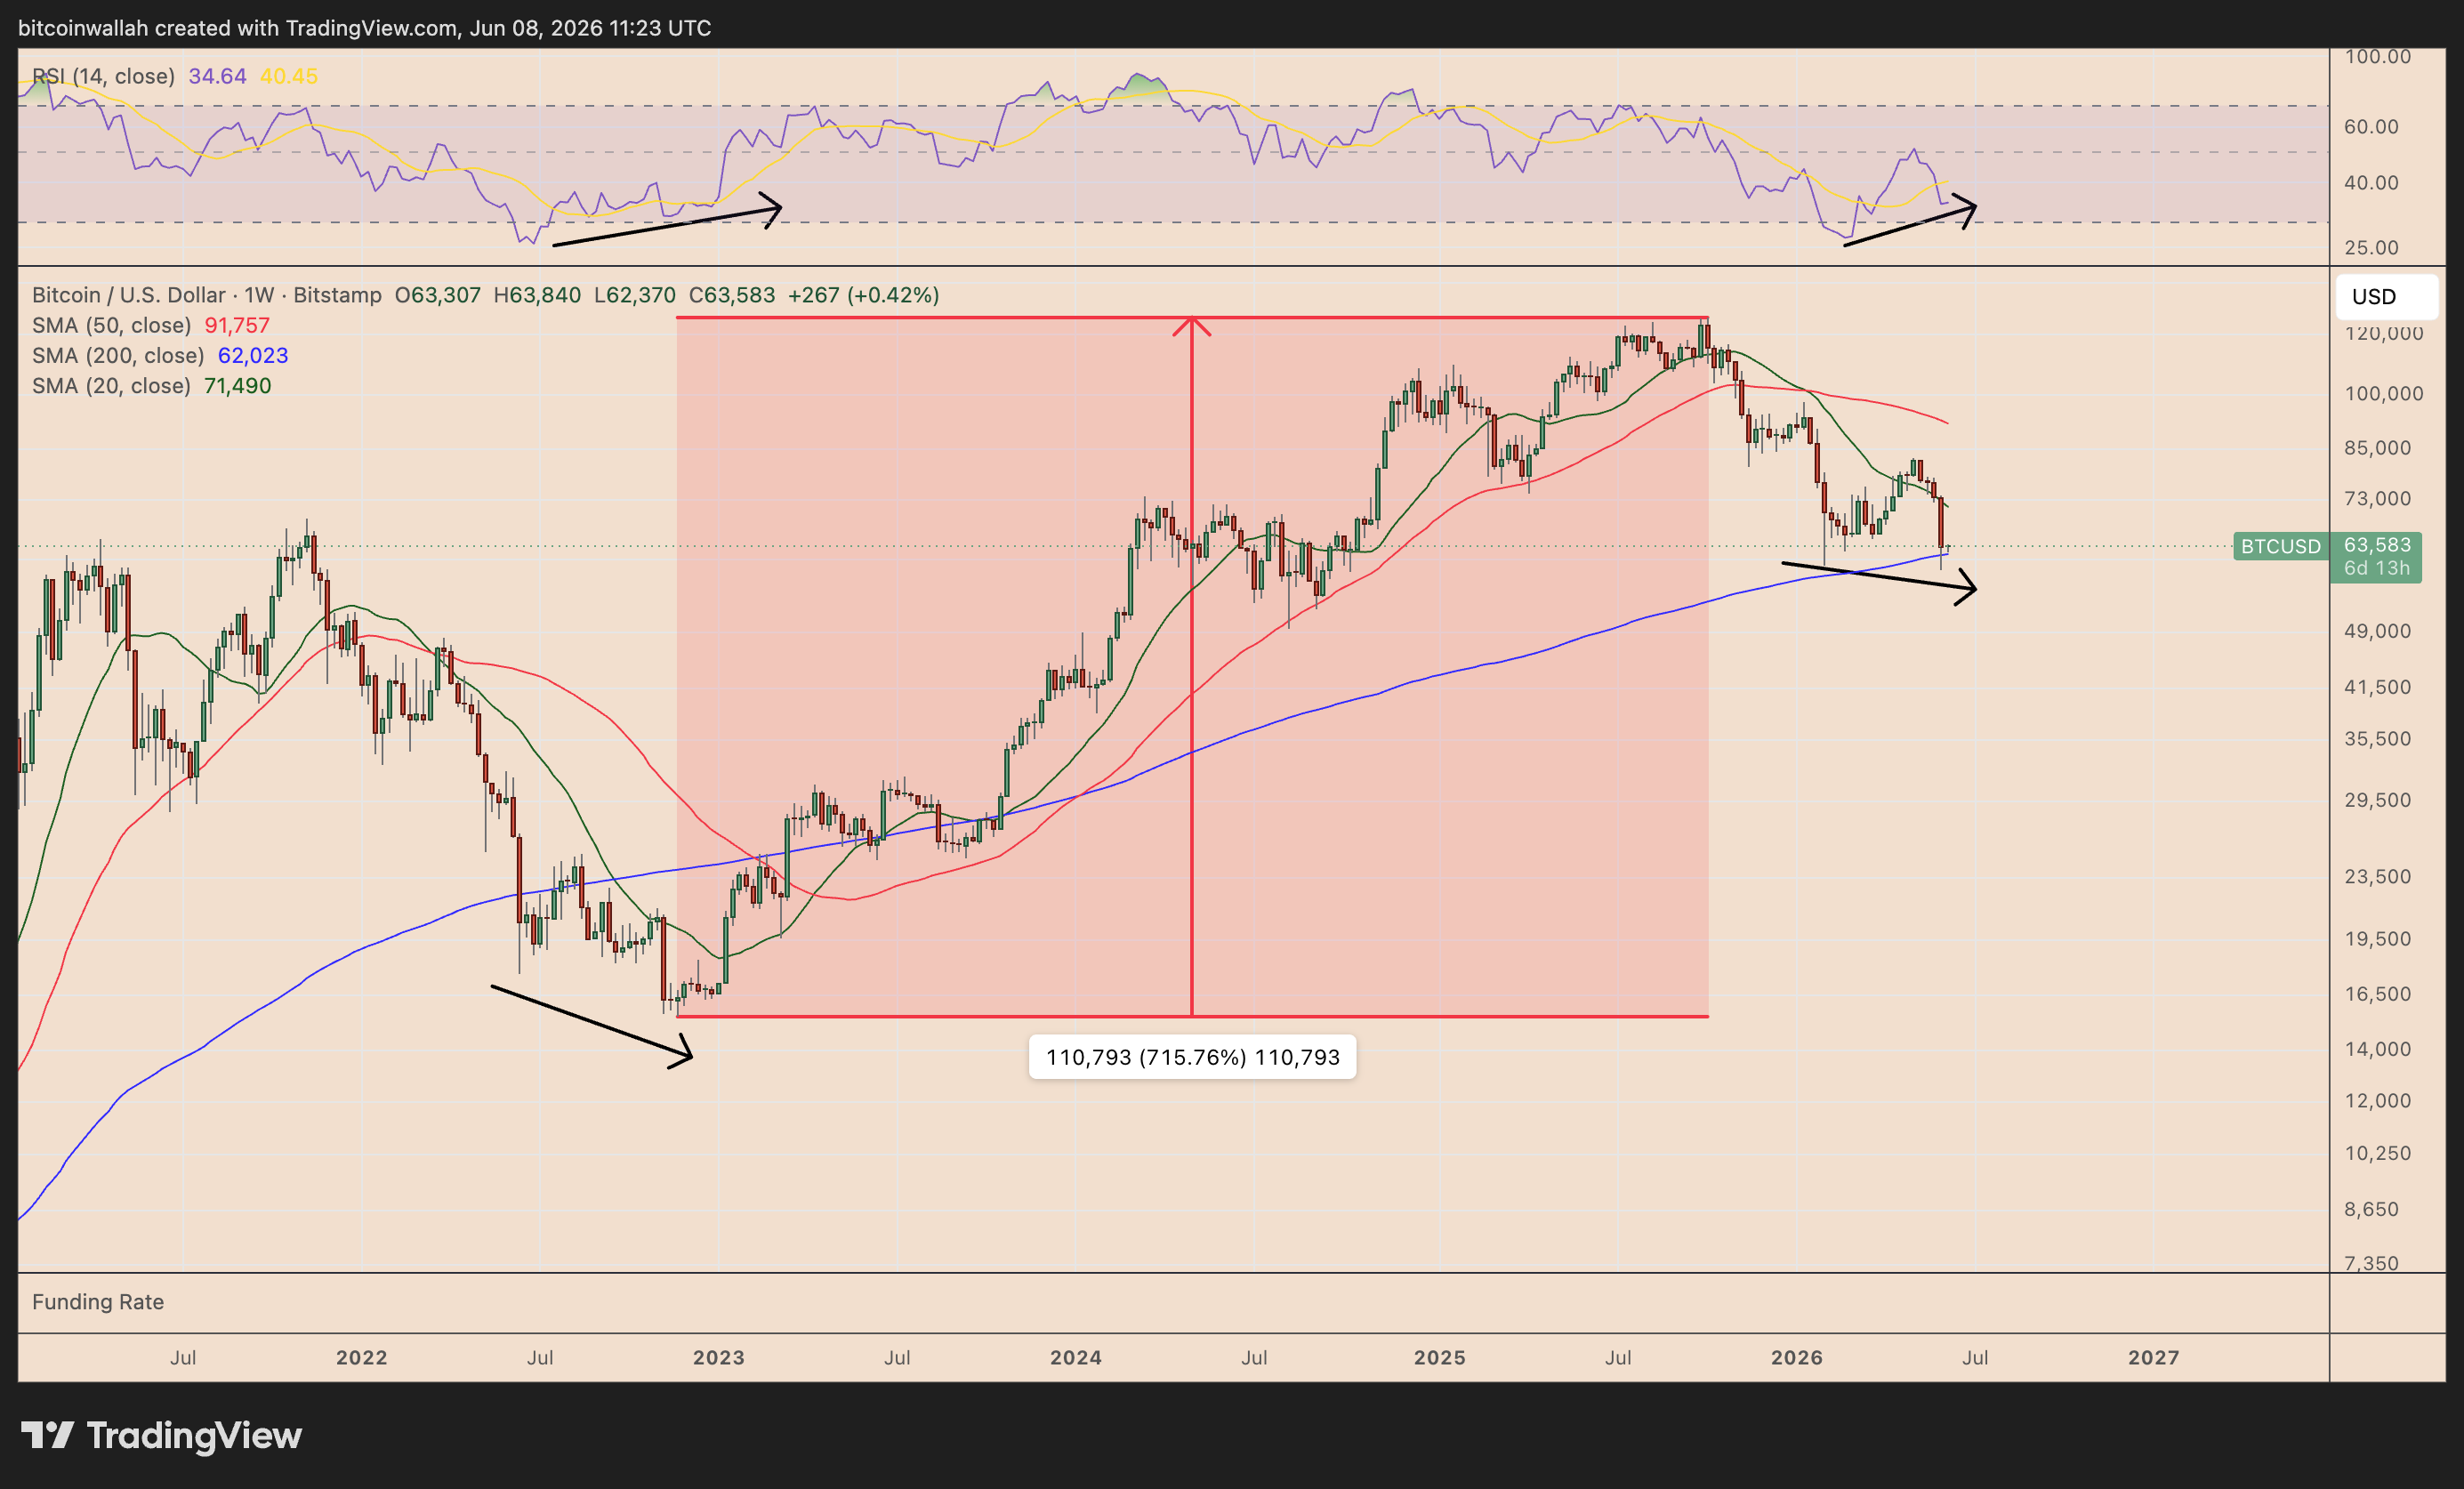
BTC/USD weekly chart. Source: TradingView
That historical precedent puts Bitcoin’s nearby upside levels back in focus. The first major target is the 50-week simple moving average (50-week SMA, red line) near $91,755, which often acts as dynamic resistance during recovery attempts.
Bitcoin holds historic bottom zone near $62,000
The bullish case is further supported by where the divergence is forming.
Bitcoin is holding near its 200-week SMA (blue line), currently at around $62,000. This line has acted as a bottom zone at the end of the 2015, 2018, and 2020 bear markets.
Analyst Michael van de Poppë called the 200-week SMA an “ideal area to accumulate,” albeit adding that bulls must break above the $64,000-65,000 area for further bullish confirmation.
“If that breaks, there’s nothing stopping Bitcoin from running all the way towards $71,500-73,000 and potentially even as high as the CME gap at $79,000,” he said in a Monday post.
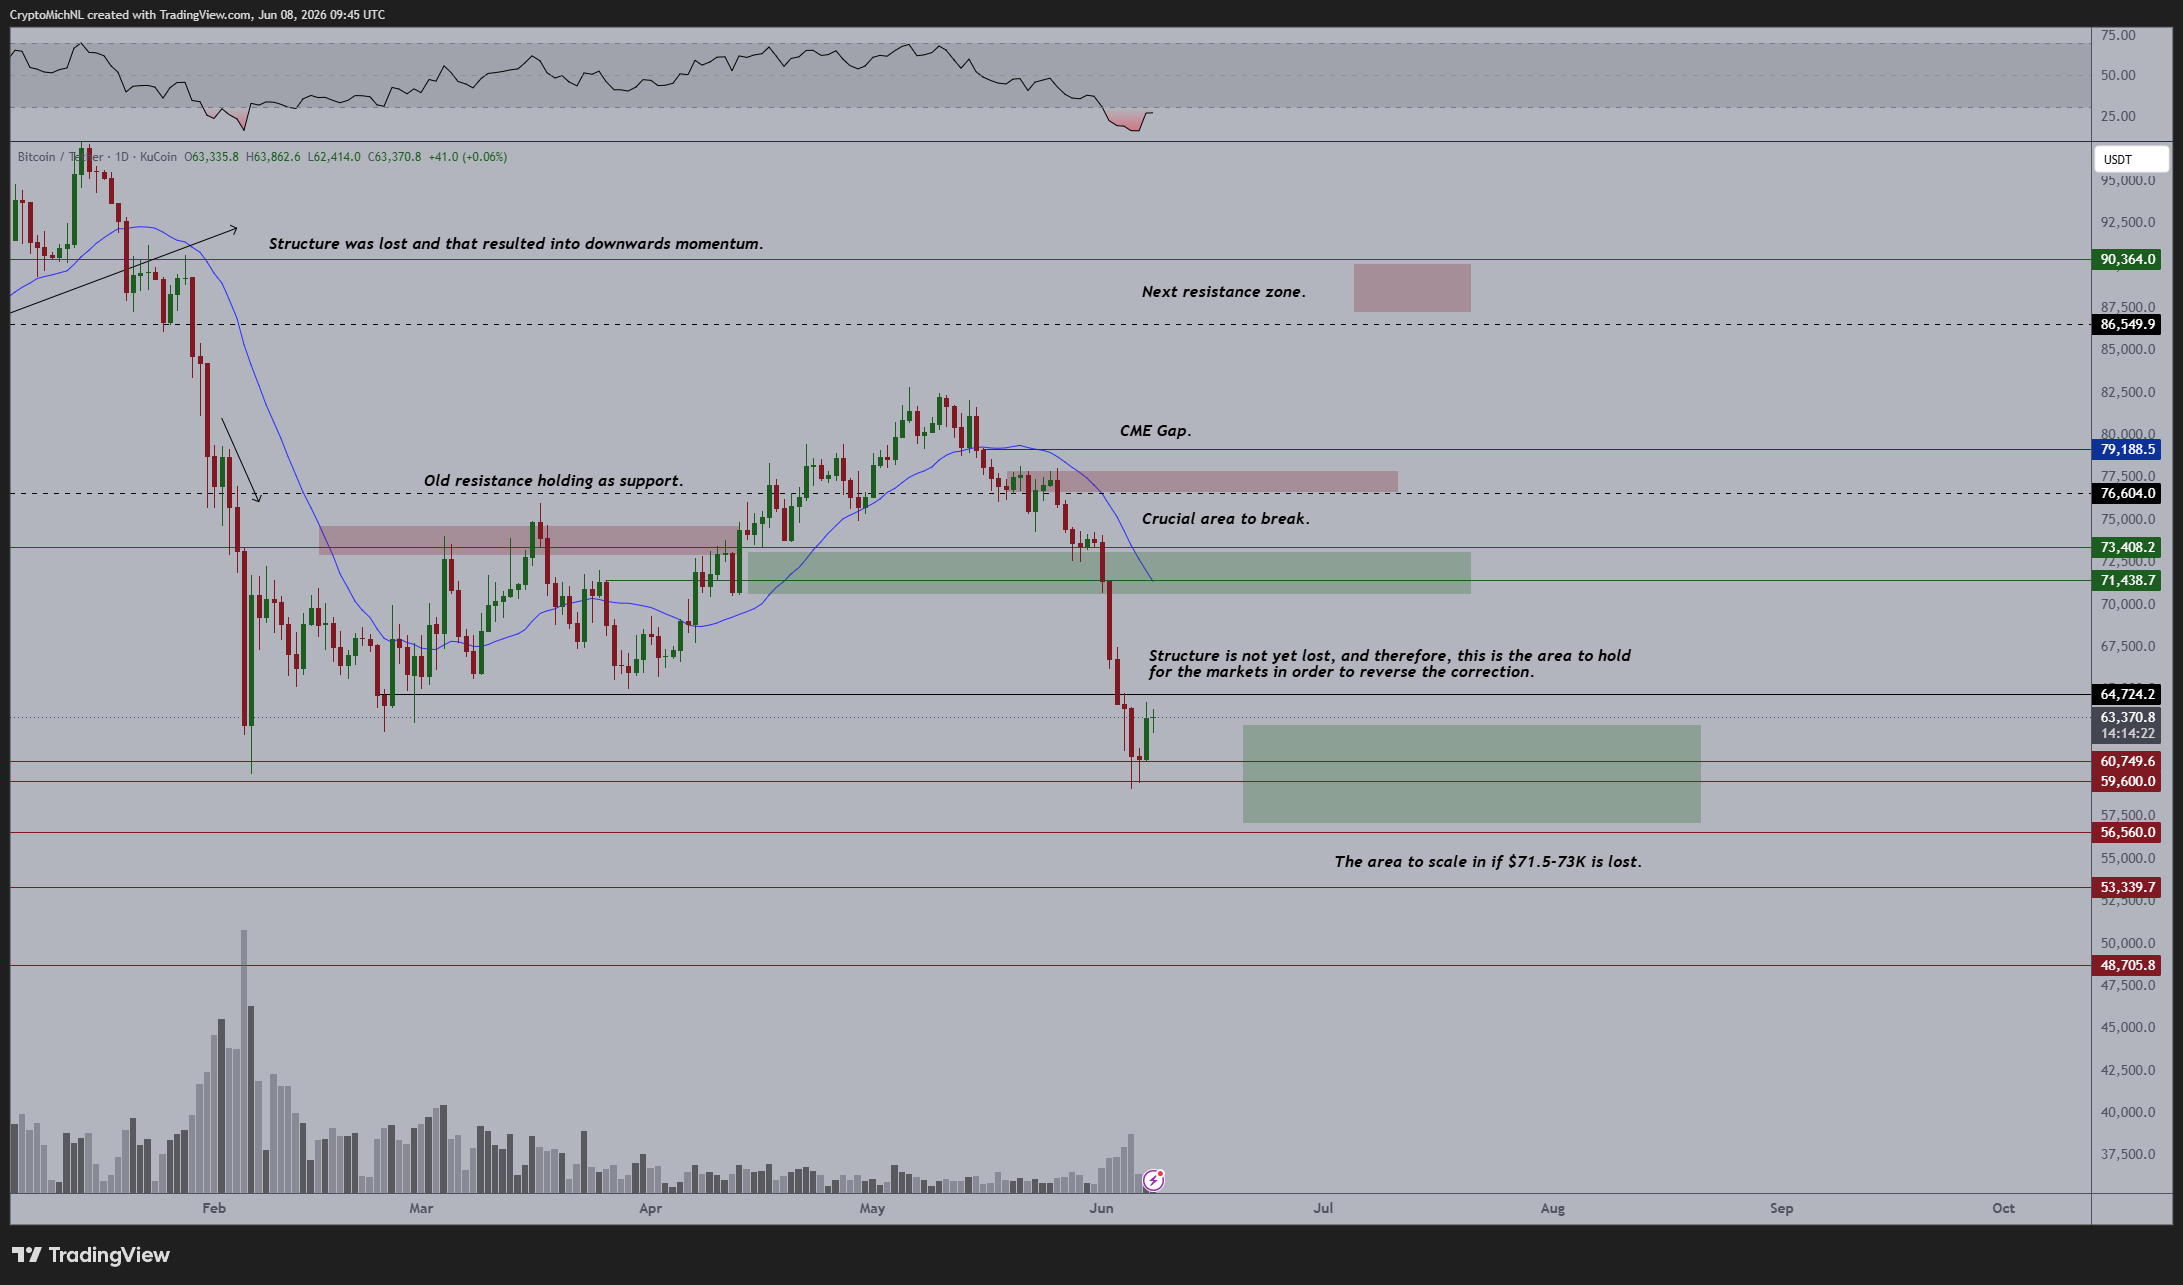
BTC/USD daily chart. Source: Michael van de Poppë/TradingView
In the same analysis, Van de Poppe highlighted the area above $90,000 as the “next resistance zone,” aligning with the 50-week SMA target.
Bitcoin bear flag keeps $50,000 price target in focus
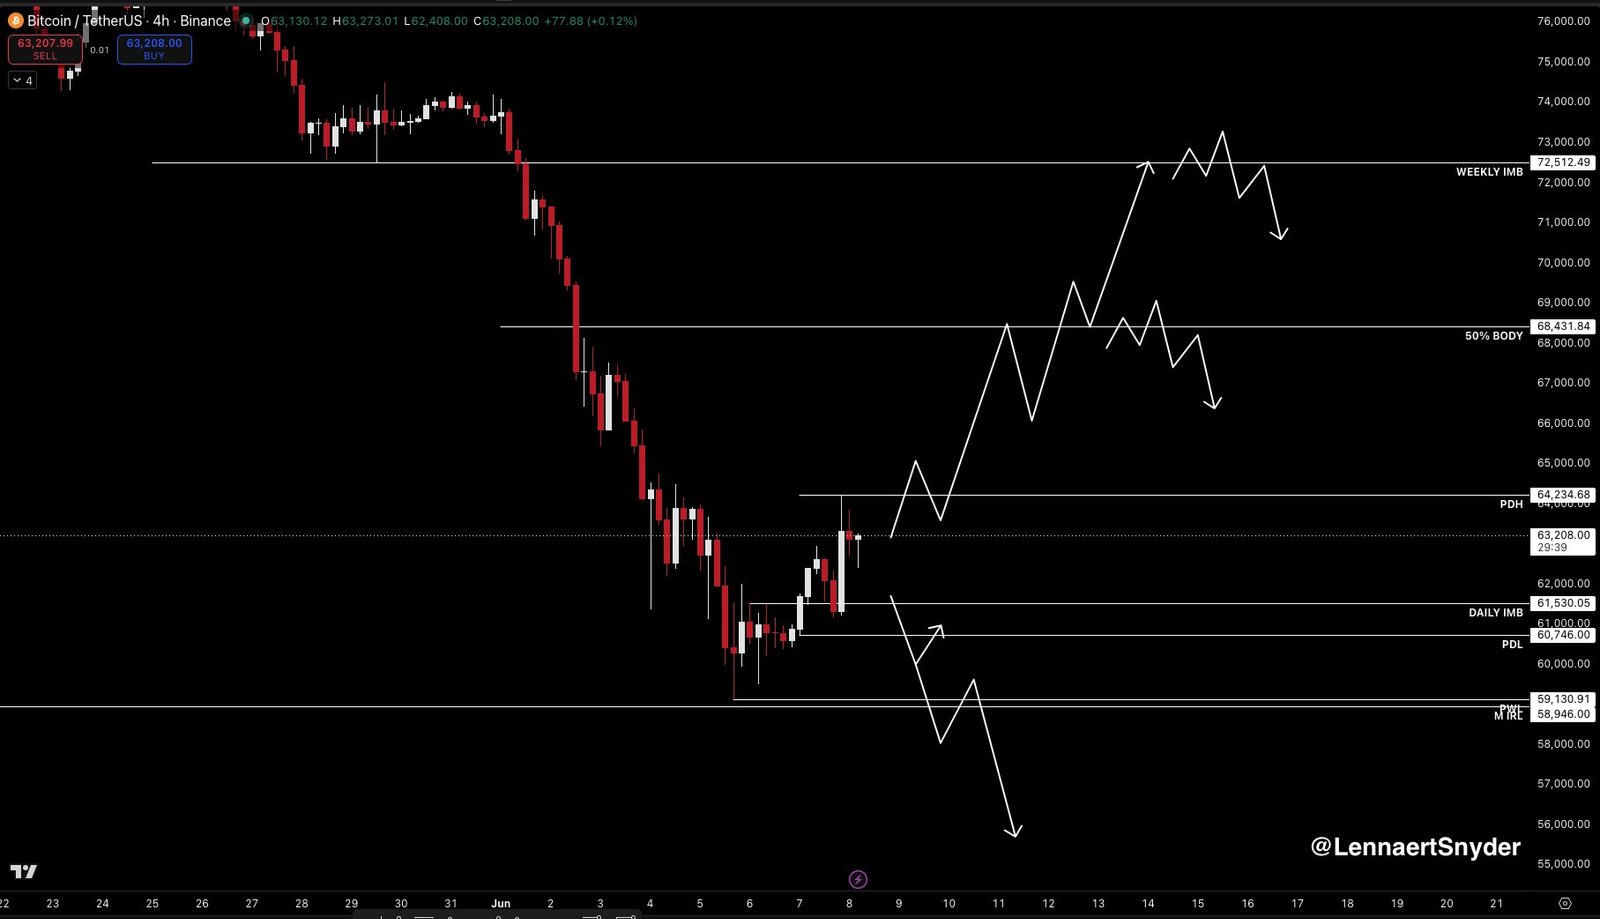
Bitcoin’s bullish divergence setup is forming while BTC is already in the breakdown stage of a weekly bear flag, keeping downside risks alive.
Related: BTC price bottom not due until Q4? Five things to know in Bitcoin this week
A bear flag forms when the price rebounds inside a rising parallel channel after a sharp decline, before breaking lower again. Bitcoin has now slipped below that channel, similar to its breakdown from the symmetrical triangle consolidation in 2022.
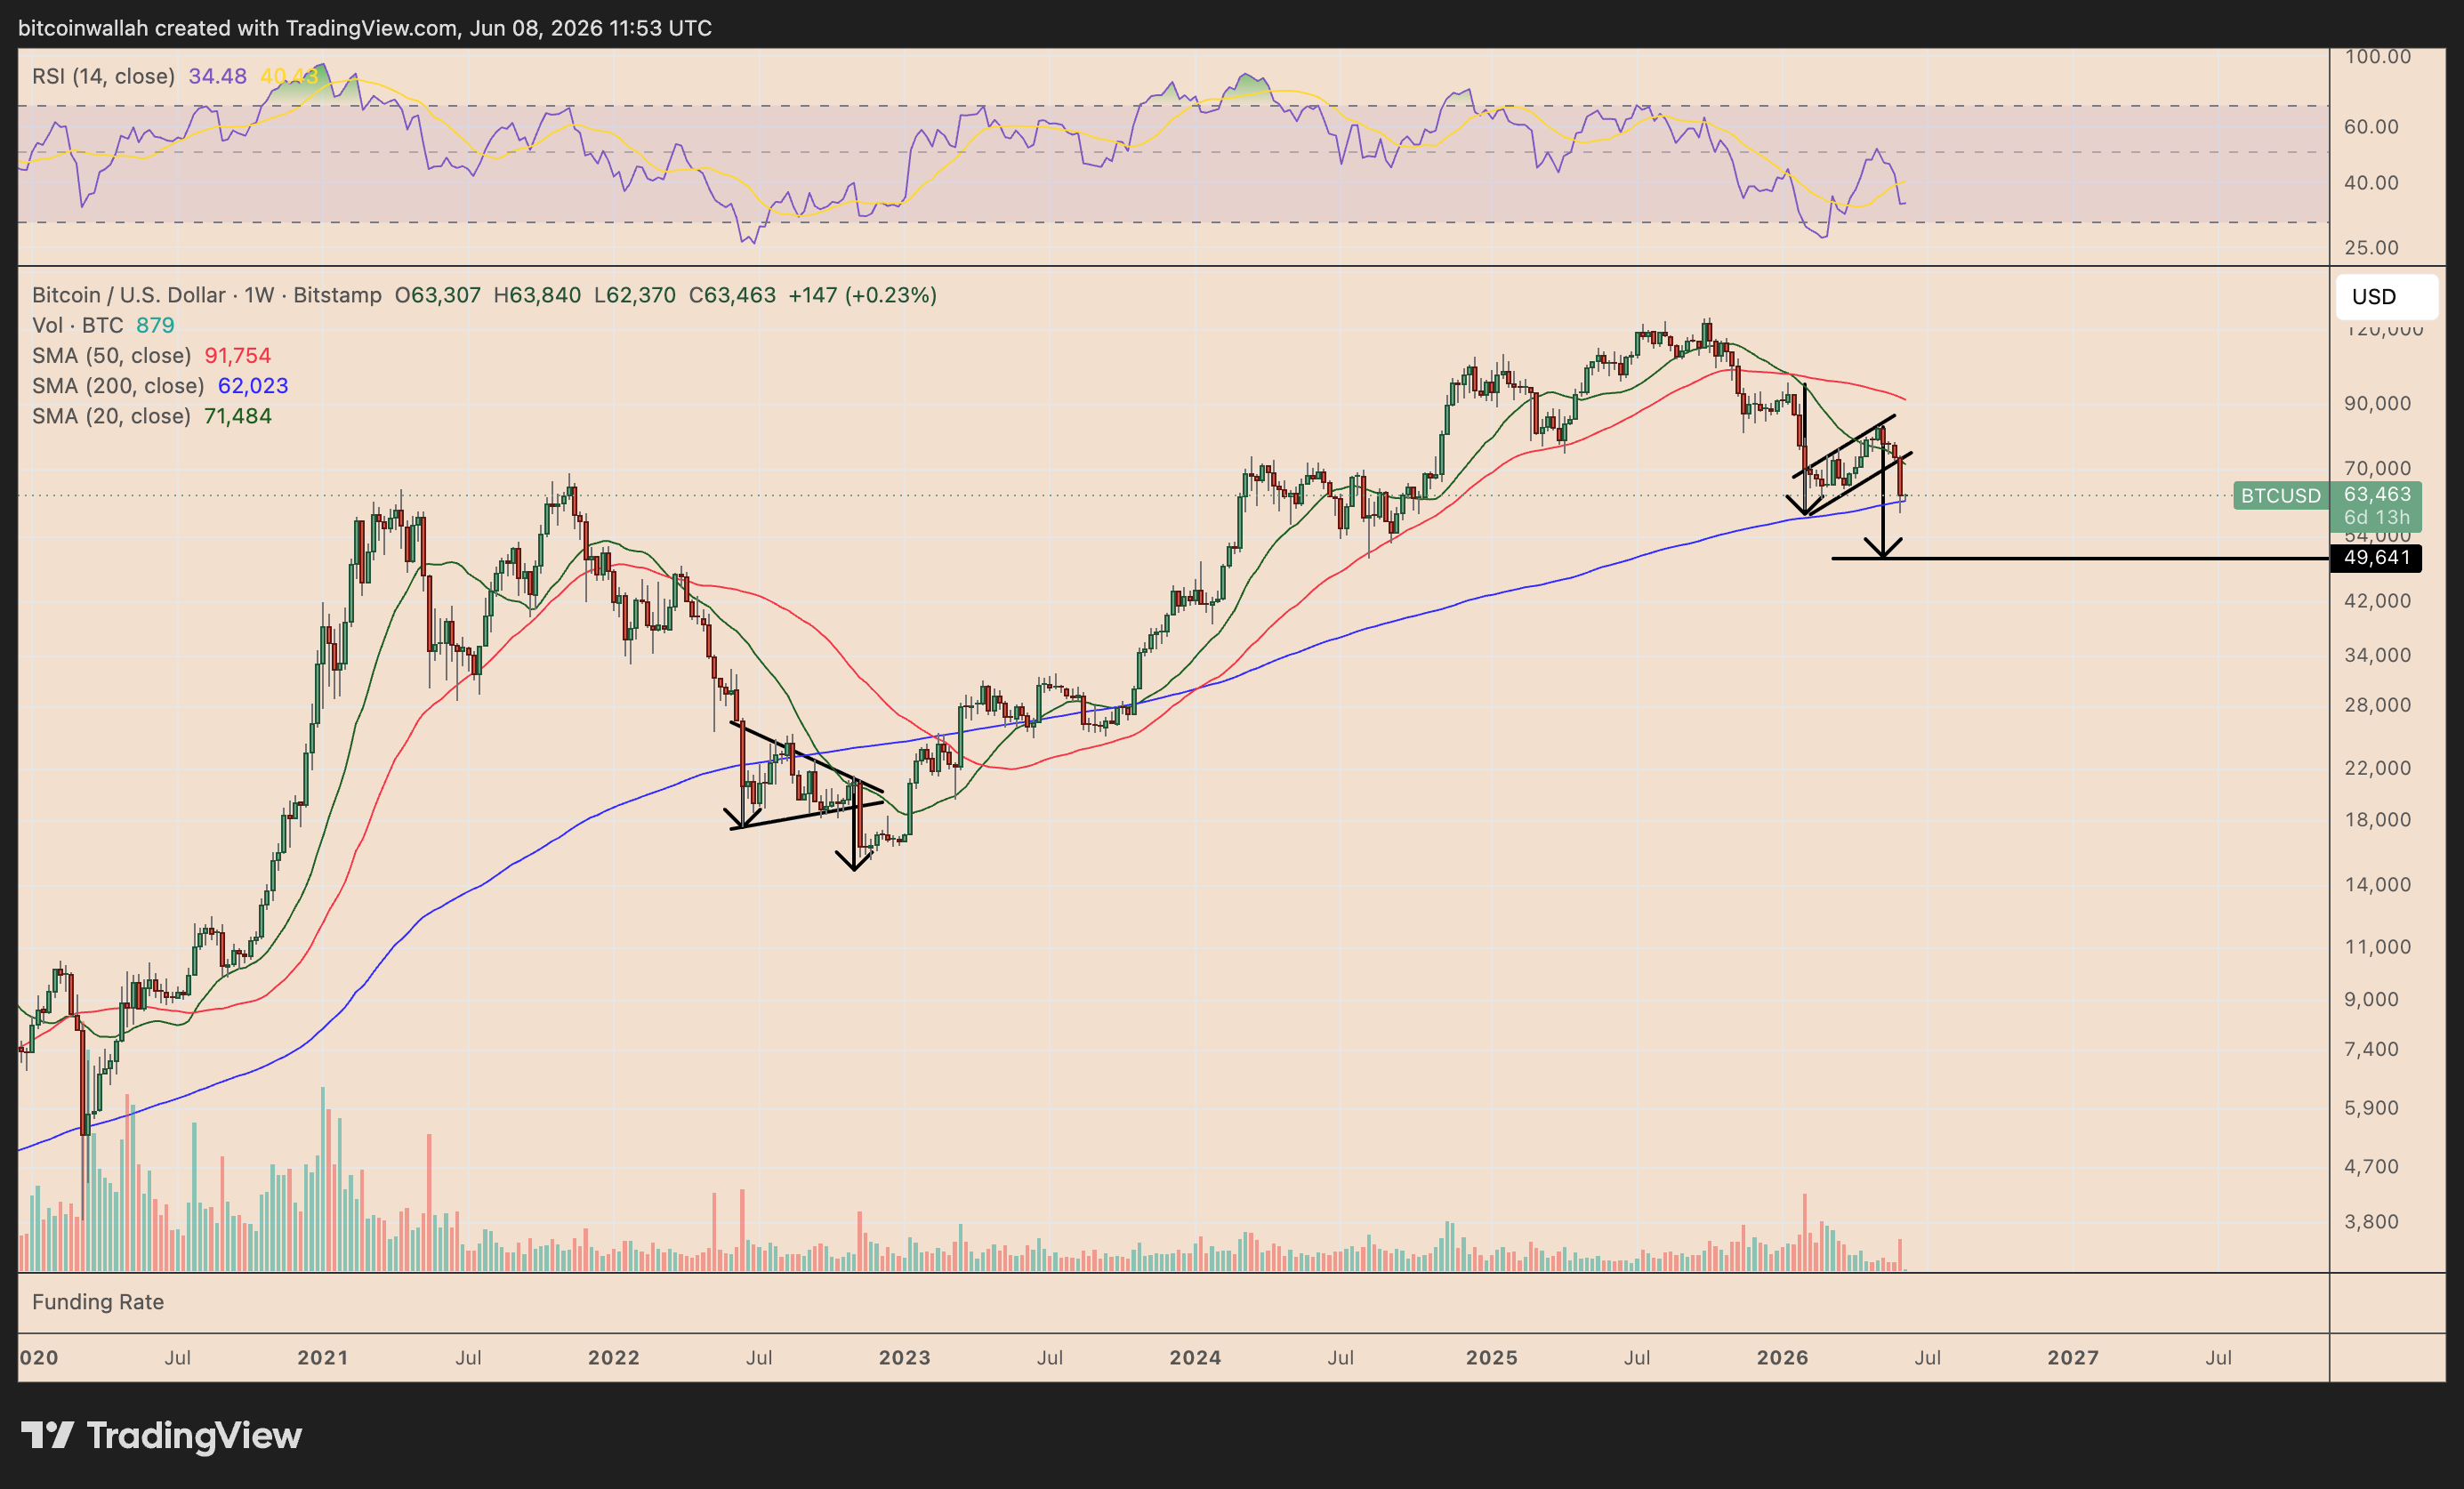
BTC/USD weekly chart. Source: TradingView
BTC risks falling toward the bear flag’s measured target under $50,000 if the pattern plays out. That level would remain in focus unless Bitcoin reclaims the flag’s lower trend line as support.