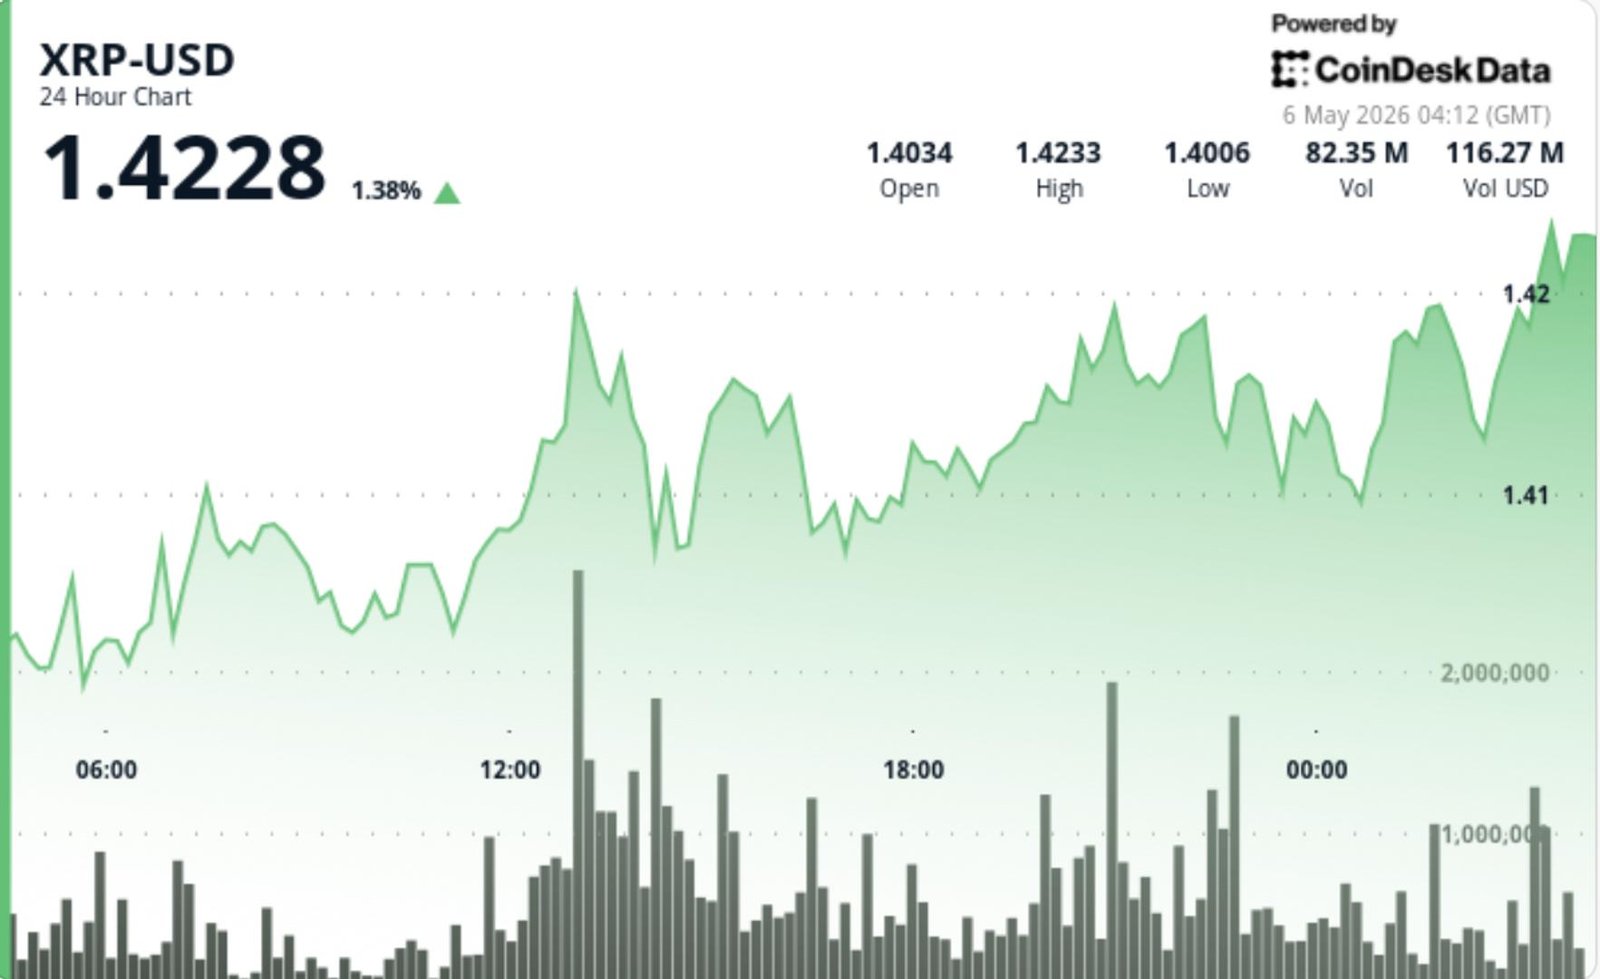

XRP is back above $1.42, and traders are starting to focus on a chart setup that sent XRP up 66% in less than two weeks when it appeared in 2025.
News Background
• Analysts flagged a repeating XRP chart fractal from 2025, when a breakout from a multi-week bull flag triggered a rally toward all-time highs above $3.
• A bull flag is a pattern where price jumps sharply, then moves sideways or slightly lower for a while before potentially breaking higher again. Traders usually see it as a pause in momentum rather than a full reversal.
• Current price action again shows XRP breaking out of a bull flag while the 20-day and 50-day moving averages approach a bullish crossover.
• Some traders now view holding above $1.40 as critical, with the level acting as both psychological support and the upper boundary of the recent flag structure.
Price Action Summary
• XRP climbed from $1.4011 to $1.4184, extending its weekly gain to nearly 9%.
• A 74.6M volume spike at 13:00 pushed price to $1.4207 before momentum cooled into consolidation.
• The token spent the final hours stabilizing between $1.417-$1.420 after repeated tests of the $1.422 resistance zone.
Technical Analysis
• XRP continues building higher lows, keeping short-term bullish structure intact above $1.40.
• The repeated tests near $1.42 matter because resistance weakens each time sellers fail to force a deeper rejection.
• Liquidity on Binance has fallen to its lowest level since 2020, which historically creates conditions for outsized moves once ranges finally break.
• The broader setup resembles the 2025 breakout structure where XRP compressed for weeks before accelerating sharply higher.
What traders should watch
• $1.42 remains the key breakout level. A clean move above it opens the path toward $1.47-$1.50.
• Holding above $1.40 is equally important because failed breakouts often turn into fast reversals once momentum fades.
• If the range finally resolves lower, $1.34-$1.37 becomes the first major support zone traders watch.